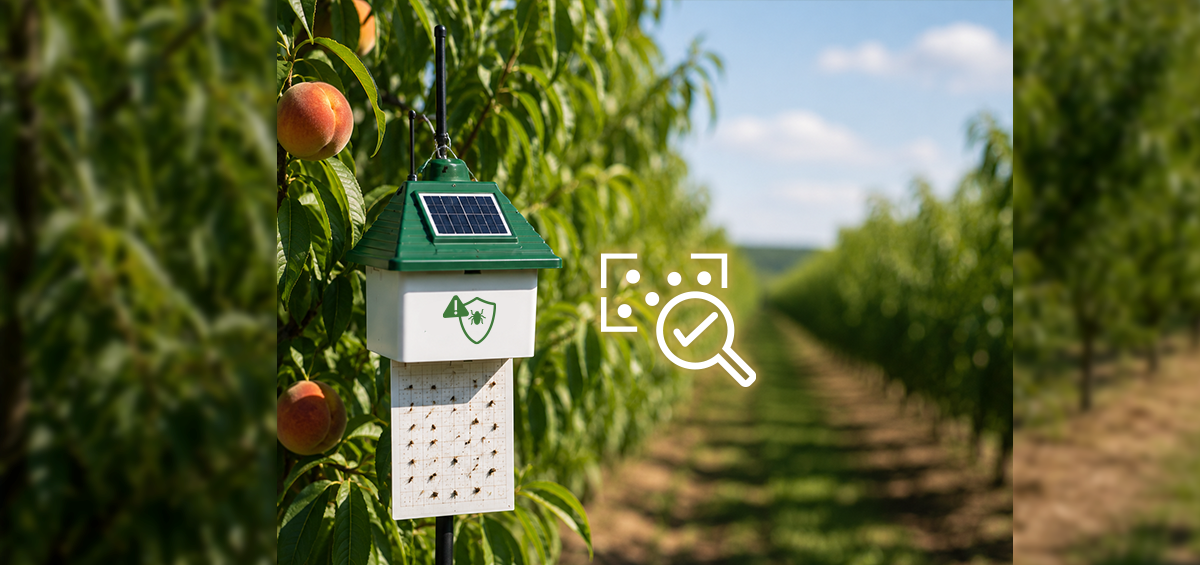
Electronic pest traps have changed how farms monitor insect pressure. Instead of relying on weekly scouting visits alone, agronomists now track pest activity through automated devices. These devices capture and count target species in near real time. Yet in most operations today, that trap data lives in a standalone system. It sits apart from the platform where teams manage field operations, scouting notes, and crop protection plans. Pest trap integration solves this problem. It connects electronic trap data directly into the farm management environment and gives teams a single view of pest risk alongside all other crop signals.
Why Pest Trap Data Gets Lost in Fragmented Systems
The Food and Agriculture Organization of the United Nations (FAO) estimates that plant pests and diseases destroy up to 40 percent of global crop yields every year. That figure highlights a critical point. The quality and timing of pest management decisions directly affect profitability and food security.
For farms that use electronic pest traps, the monitoring data itself holds high value. Automated traps record daily counts and track cumulative catches over time. Many also provide species-level identification through AI-powered image recognition, as documented in peer-reviewed research on automated pest monitoring. The challenge is not the data. It is where the data ends up.
In a typical setup, trap readings live inside the trap provider’s cloud platform. Scouting observations sit in a separate tool or spreadsheet. Weather-based pest risk forecasts come from yet another source. Crop protection decisions happen inside the farm management system. When these signals scatter across three or four disconnected tools, the agronomist must mentally assemble the full picture before making a call. That takes time. And in pest management, timing determines whether an intervention prevents damage or merely reacts to it.
What Pest Trap Integration Looks Like in AGRIVI 360 FMS
The new Pest Traps module in AGRIVI 360 Farm Enterprise connects directly to TrapView, one of the most widely deployed electronic pest monitoring platforms in the world. TrapView operates across more than 50 countries. Once a farm connects its account, all shared trap devices sync automatically into AGRIVI. Their data then becomes part of the farm’s daily operational view.
The module sits under a new Risk Management section within Field Operations, alongside Scouting. This grouping is deliberate. It keeps all crop risk signals in one contextual space rather than spreading them across unrelated menus.
Here is what the integration delivers:
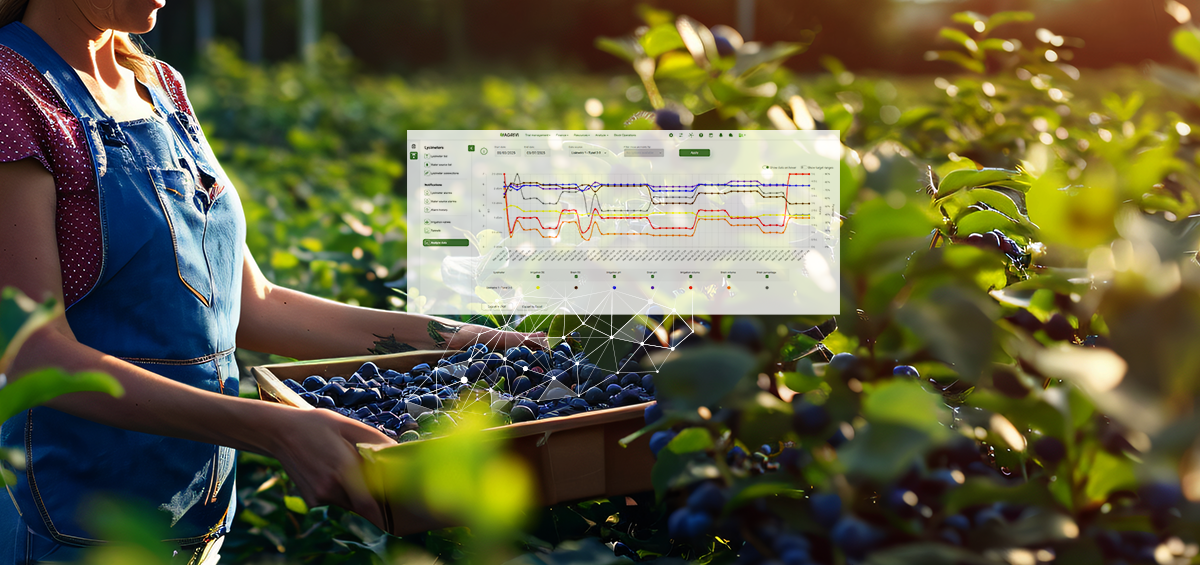
Georeferenced trap map. All connected traps appear as pins on the farm map. Each pin displays the current pest catch count. The map auto-zooms to fit all active traps when the module opens. The agronomist can scan the entire operation at a glance.
Scrollable trap list. A side panel mirrors the map. It shows every trap with its name, pest type, current count, last week’s count, and the timestamp of the last data sync.
Detail drawer with trend chart. Selecting any trap opens a bottom drawer. The drawer displays pest type, current count, last measurement date, GPS coordinates, and a time series chart of cumulative captures over the current season. The map stays visible, so the user keeps a full spatial context.
![Screenshot of the AGRIVI Pest Traps module showing the trap list panel, georeferenced farm map with colour-coded trap pins, and the detail drawer with the trend chart.]](https://www.agrivi.com/wp-content/uploads/2026/05/pest-trap-integration-farm-management-cover-2.png)
The drawer can be minimized to keep the selected trap highlighted while navigating to other fields. It can also be closed to return to the full overview. This interaction pattern follows the same logic used across AGRIVI’s scouting and field operations views. Users familiar with the platform will find the workflow immediately intuitive.
How Pest Trap Integration Helps Agronomists and Farm Managers
For Agronomists: Spot Hotspots Faster
Consider an agronomist who manages 12 fields. Before pest trap integration, the Monday morning routine looked like this. Open TrapView. Scan the trap readings. Switch to the farm management platform. Cross-reference which fields have scouting observations or upcoming spray windows. With the new module, that entire workflow collapses into one screen.
The trap list shows all active devices with their current and previous week counts. A sharp increase in one trap stands out immediately. The agronomist taps the pin on the map, confirms the field location, and checks the trend chart. She then prioritizes the first field visit of the day based on actual pest pressure, not assumption. For a deeper look at how leading operations time their first interventions, read about spring crop protection planning.
For Farm Managers: Trap Data in One Consolidated Risk View
Farm managers often start the day by reviewing operational status across their fields. With pest trap data now visible inside the same Risk Management module as scouting reports, the daily review includes pest pressure as a standard input. No one needs to open a separate platform. No one risks overlooking a trap that spiked overnight.
This matters most in larger operations where the farm manager briefs a team before they head into the field, and every risk signal sits in one place: weather-based pest forecasts, scouting notes, and live trap data. The briefing reflects the complete picture, not a partial one.
From Reactive Pest Control to Data-Driven Pest Trap Monitoring
The broader value of bringing pest trap data into a farm management platform goes beyond convenience. It shifts the decision model.
When trap data stays siloed, it serves a narrow purpose. It confirms whether a specific pest exists at a specific location. That information is useful, but it represents only one signal. When that same data sits alongside weather forecasts, risk models, scouting observations, and historical field records, it becomes part of a decision framework. Agronomists can then correlate trap spikes with recent weather conditions. They can validate whether a forecast-based alert was accurate. They can ground treatment decisions in multiple confirming signals rather than a single data point.
This layered approach aligns with the principles of integrated pest management (IPM), a strategy the FAO endorses globally. IPM emphasizes combining monitoring, biological controls, cultural practices, and targeted chemical interventions. The goal is to reduce reliance on calendar-based spraying.
How to Set Up Pest Trap Integration in AGRIVI 360 FMS
Connecting pest traps in AGRIVI 360 FMS takes a few steps. First, navigate to the Pest Trap setup within Field Operations. Then create a connection and select TrapView as the provider. The system redirects you to the TrapView platform to authenticate. Once you log in, select which trap devices to share with AGRIVI. Synchronization starts automatically after you confirm.
A few technical details to note. The feature works at the farm account level only. It does not appear on cooperative accounts. TrapView provides all trap geolocation data, so AGRIVI displays the coordinates that TrapView assigns to each device. This release covers Phase 1 of the integration. It includes pest type, current count, last week count, last sync timestamp, coordinates, and the cumulative trend chart. AGRIVI plans to add more data layers and deeper historical analysis in future releases.
If you want to explore how AGRIVI 360 FMS fits into your operation, you can schedule a walkthrough with our team.
Frequently Asked Questions About Pest Trap Integration
What electronic pest trap providers does AGRIVI currently support?
The current integration supports TrapView. TrapView is one of the most widely deployed automated pest monitoring systems globally, with operations in more than 50 countries. AGRIVI may add support for additional providers in future releases.
Do I need a separate TrapView subscription to use the Pest Traps module?
Yes. AGRIVI pulls trap data from TrapView’s cloud platform, so you need an active TrapView account with registered and active trap devices before those devices can appear in AGRIVI.
Can I use Pest Traps on a cooperative account?
Not in this release. The Pest Traps module works on farm accounts only. Phase 1 does not include cooperative-level access.
What data does the Pest Traps module show?
Each trap displays pest type, current catch count, last week’s count, the timestamp of the last synchronization, GPS coordinates, and a time series chart. The chart shows cumulative pest captures over the current season.
How does pest trap integration improve crop protection decisions?
When trap data sits alongside scouting reports, weather-based risk forecasts, and field operation records, agronomists can base treatment decisions on multiple confirming signals. This approach supports earlier, more precise interventions. It reduces both crop loss and unnecessary input costs.
Does pest trap integration work for both open-field and greenhouse operations?
Yes. The module supports both setups. The only requirement is that traps are registered and active in TrapView.