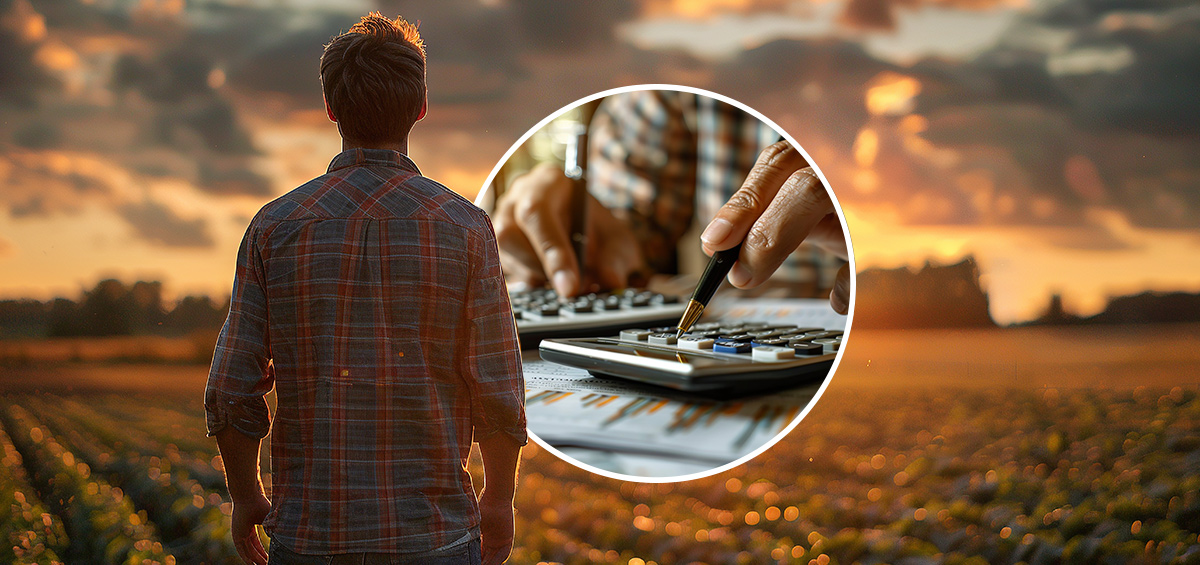
All farmers have common goals- to reach high yields and deliver quality crops to the market, hence creating a better chance for profit. Geared towards the best results, farmers frequently wonder about the secret to success. Unfortunately, there is no unique secret. Successful farmers are made, not born. Therefore, farmers who constantly seek to improve their farm management and broaden their scope are definitely one step closer to a profitable crop production.
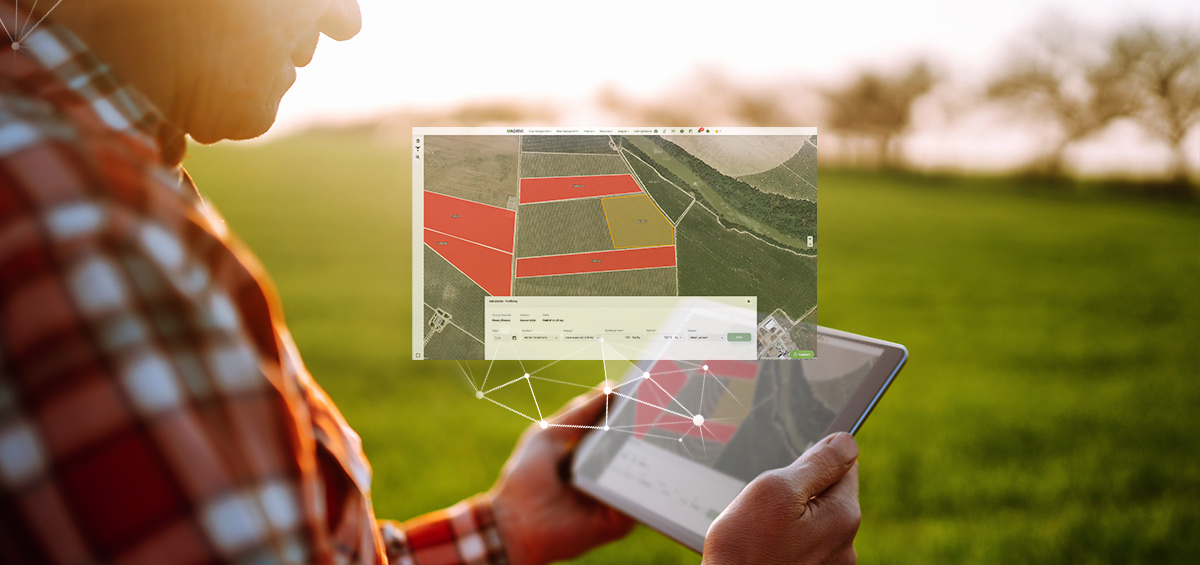
Fortunately, technology is increasingly taking over the agriculture sector. Today’s farmers have a real opportunity to revolutionize their management. In response to this, farmers can make their farm management decisions based on real-time data instead of relying on gut feelings. Data-driven farm management is definitely a unique thing that sets apart the most successful farmers from their peers.
Yield Mapping Has a Valuable Story to Tell
Regarding technological development, modern agriculture has a lot to offer. Over the last few decades many new precision farm technologies have been developed. The agtech boom has revealed a completely new dimension of farm management. One of the first precision farming technologies was yield mapping.
Yield mapping is a technology that collects the data about the yield and other crop characteristics during the harvest, and over a specific location. This remarkable technology allows farmers to view the spatial yield variation across the field. More importantly, by using yield maps, farmers can make yield comparisons over time and adapt their farm management according to the field variability. As a result, the farmer can easily determine which areas are productive and which are not and then investigate the main cause of this difference. Additionally, grain yield mapping enables farmers to make decisions regarding storage based on grain moisture data.
Yield mapping was originally developed and improved for grain yield monitoring. Later, scientific experiments and farm machinery producers focused on developing yield mapping for fruits and vegetables. However, yield mapping technology is most frequently used in grain production.
How Does Grain Yield Mapping Work?
Grain yield mapping works simply: as the combine passes over the field, the system collects georeferenced data of the crop yield using a range of sensors and creates a yield map.
The main components of a grain yield mapping system include:
1. Grain flow sensors
Grain flow sensors measure the amount of grain harvested by a combine in a unit of time. They can be categorized as:
- Volumetric grain flow sensors, which measure the volume of harvested grains in two ways; by using a paddle wheel or individual elevator paddles.
- In using a paddle wheel; grains come out of the elevating auger to a paddle wheel, the sensor activates when the grain level reaches the capacity closely to the sensor; the paddle wheel rotates in response to the level in which the sensor is activated.
- In using individual elevator paddles; as each individual paddle moves up the grain elevator, the sensor measures the amount of light that passes between the grain mass.
- Mass grain flow sensors measure grain mass. There are few different types:
- Impact-types; the most popular method; measure the force in which grains strike an impact plate (load cell converts the load into electrical signal) or displacement of the plate when the grain strikes.
- Weighing-types; measure the grain mass by using load-cells placed in augers or grain tanks; as the grain passes through the combine’s auger, the sensor measures its mass; grain flow rate is measured based on the load cell electric impulse.
- Radiometric-types; measure grain mass flow as the grain passes between the source of radiation and radiation sensor.
2. Grain moisture sensor captures a subsample of crop and measures the real-time moisture (by measuring the di-electric property of a substance) in order to calculate the dry basis crop yield; usually located in the conveying system near the grain flow sensor.
3. Ground speed sensor calculates the distance which combine travels in a certain interval (it can also be measured with a GPS receiver, radar, or ultrasonic radar).
4. Header position sensor (also called header switch) detects when the header is in raised position and stops measuring yield until the header reaches cutting height; the threshold height can be adjusted for each crop.
5. Grain elevator speed sensor is used to establish the speed of the grain elevator and therefore improve the accuracy of grain flow measurements.
6. GPS system provides georeferenced data for each location as the combine harvests throughout the field; connected with display console; some producers offer an autosteering option.
7. Display console with a GPS receiver shows the values of each sensor in real-time (such as harvested area, current yield, average yield, crop moisture, travel speed) and serves to manage sensor calibration, as well as stores data on a removable memory stick.
Grain Yield Mapping as a Driver of Change
Yield mapping often raises more questions than answers. Once the yield mapping is finished, it’s up to the farmer to find the cause of yield variability and turn the buckets of data into valuable information. By tracking the yield maps for a few years, farmers can track performance of different crops and varieties on each field and eventually improve their farm management. In this regard, it’s extremely important that farmers distinguish variabilities caused by natural factors from variabilities caused by applied farm management practices.
All things considered, knowing the exact yield on each location is a first step towards producing higher yields in upcoming farm seasons.