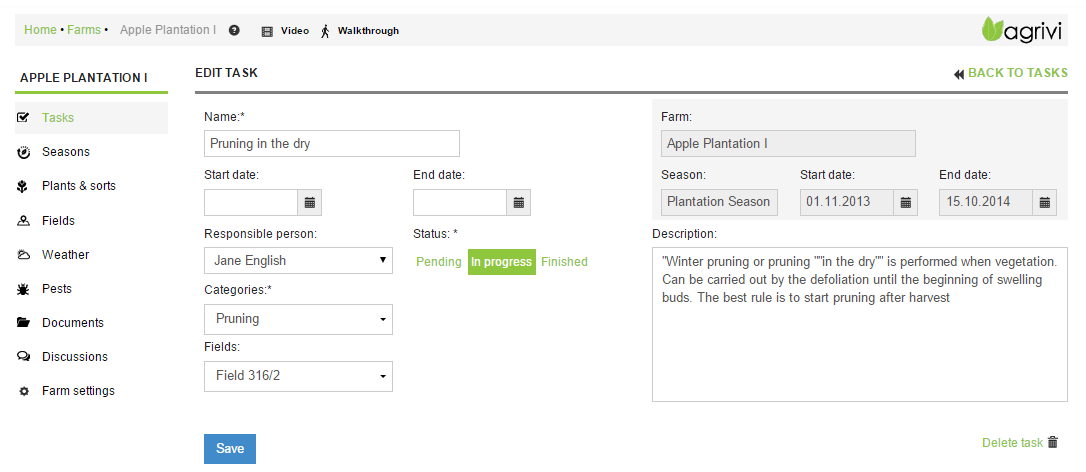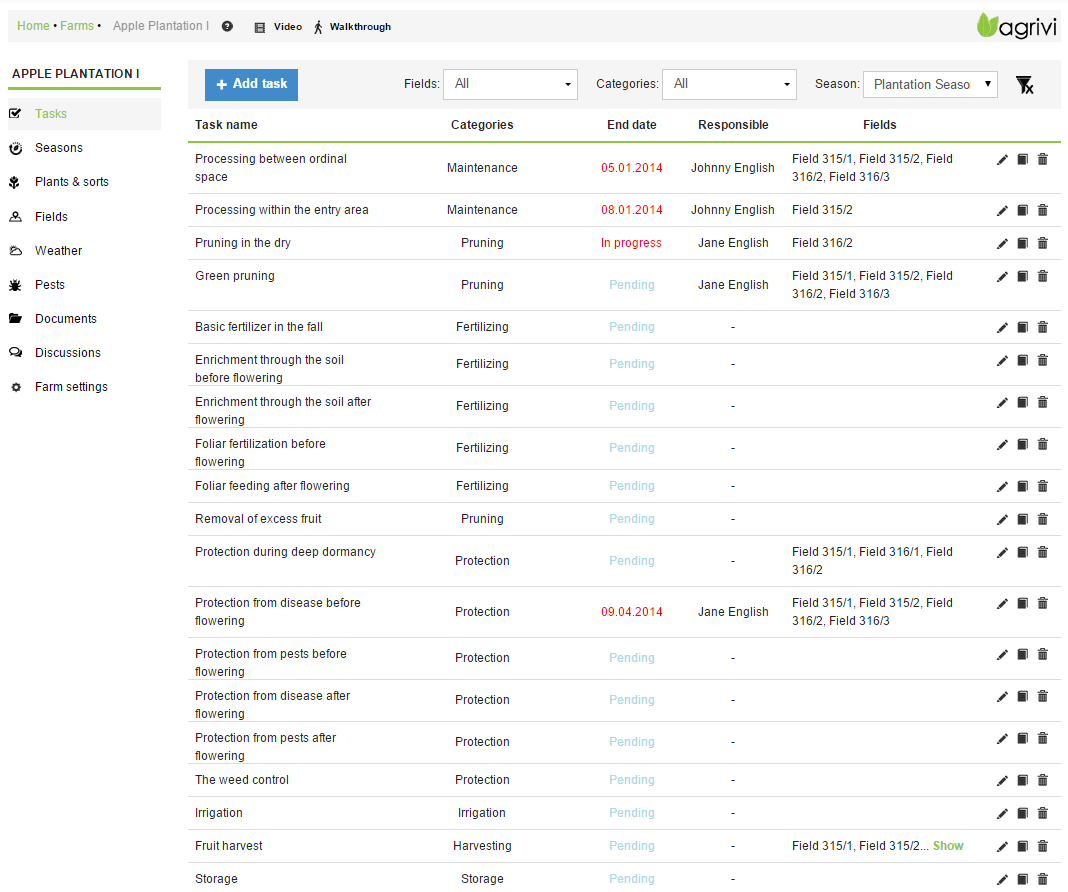
New interface has the navigation menu on the left side of the screen, while the right side is reserved for displaying farm details – tasks, seasons, linked fields, weather forecast, pests etc. This way you can switch through different views more quickly and get a better overview of your farm’s current state.
Tasks details view experienced the biggest ‘face lifting’ in this redesign process. Now you can mark one or more fields on which some task is performed and track exact input usage per field. Another novelty is adding multiple activity categories to your tasks. This way, for example, if you apply fertilizers or chemicals (pesticides) through an irrigation system, you can register water, fertilizer and pesticide usage on the same task with just a few clicks.
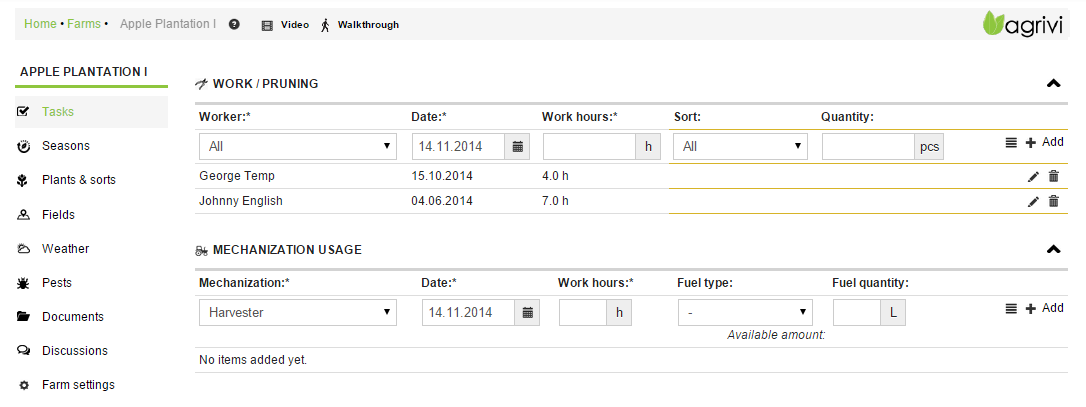
Registering input usage, work hours, pruning and harvesting is something that can take a lot of time for farmers, especially if they have more farms and workers. That is why you’ll love this new way of registering your farming activities. Every input usage, pruning or harvesting quantity that is registered on a task is automatically distributed on all fields that are marked to that task, according to field’s surface. Except automatic distribution, user can manually edit those quantities for each field. This way user can for example quickly enter just the total used quantity of some fertilizer (which is then automatically distributed) or precisely enter used quantity for each field. Of course, every activity is mapped to the inventory so in each moment users know exactly how much of every item there is on the inventory. That’s all for this article, we’re sure you’ll find these novelties very useful! We’ll continue to work hard on delivering more new features, and first of them will be the new inventory design which is expected to be live in the next few weeks. Continue to read our blogs and stay informed.

