Current crop yields
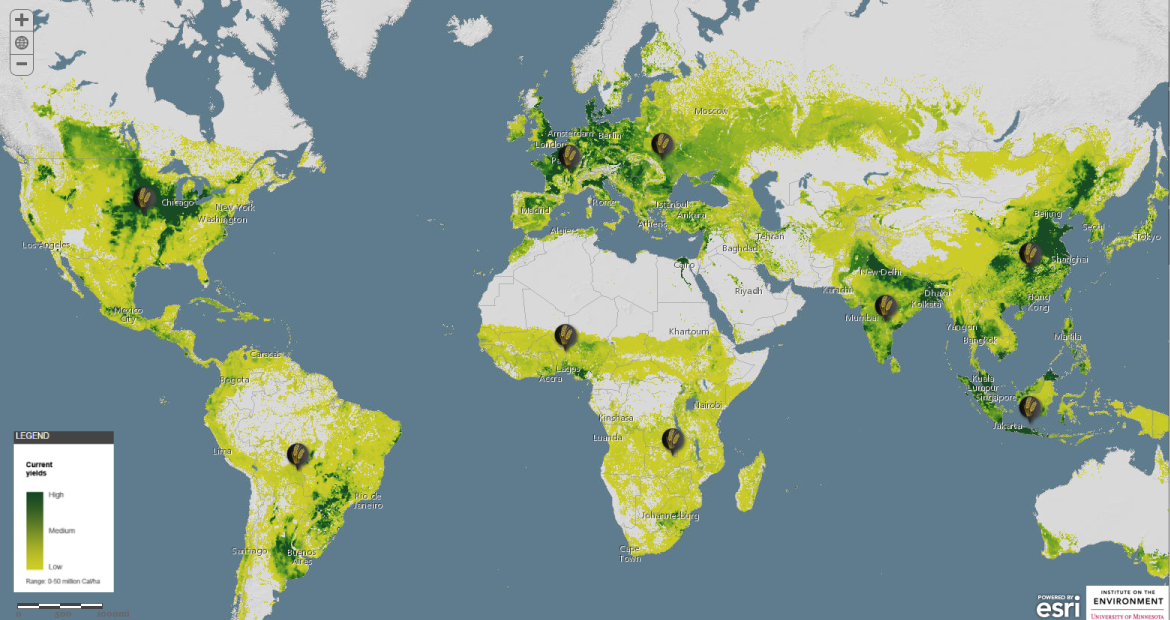
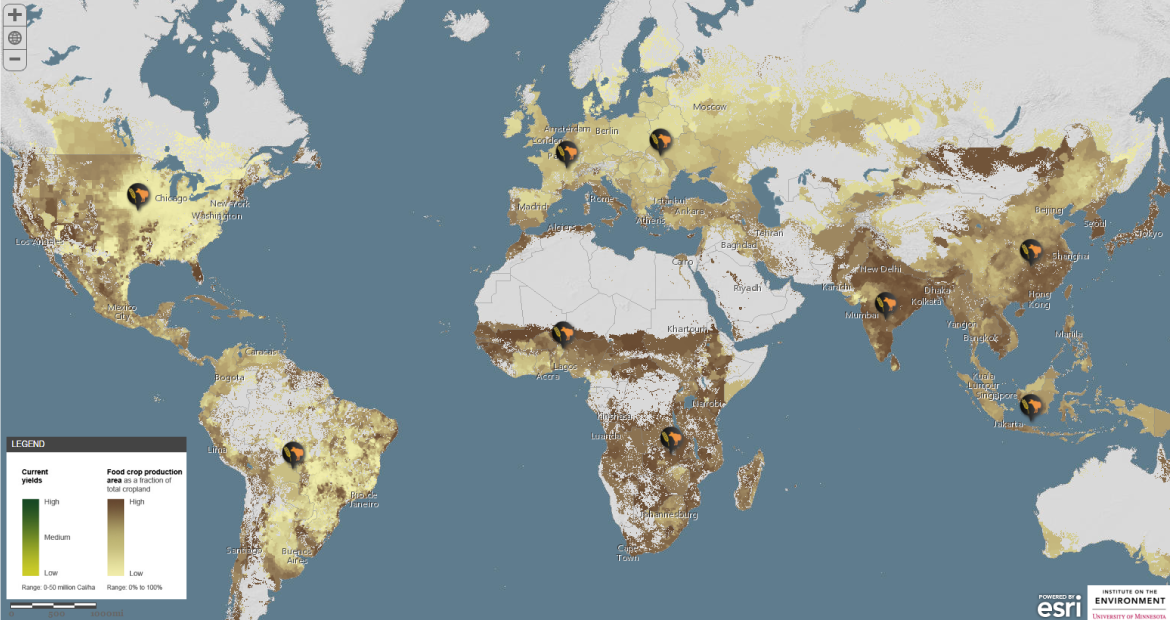
Agricultural yields vary widely around the world due to climate, management practices and the mix of crops grown. You can see this yield difference on a map, which shows average yields for few major crops, mainly cereals. Data were compiled by fusing agricultural census records with satellite images. Crop yields are very high throughout most of the Great Plains in North America, resulting from good soils, high fertilizer inputs, and irrigation (particularly in the western portion of the region). Throughout most of Eastern Europe and western Africa crop yields are moderate while throughout eastern and southern Africa Crop yields range from low to moderate. Climate, poor soils and limited nutrient and water management all contribute to low yields. Throughout most of Brazil, India, China and Indonesia crop yields range from moderate to high, due to more rainfall. The highest yields in Indonesia are where oil palm, a high-calorie crop, is abundant.
Closing yield gaps
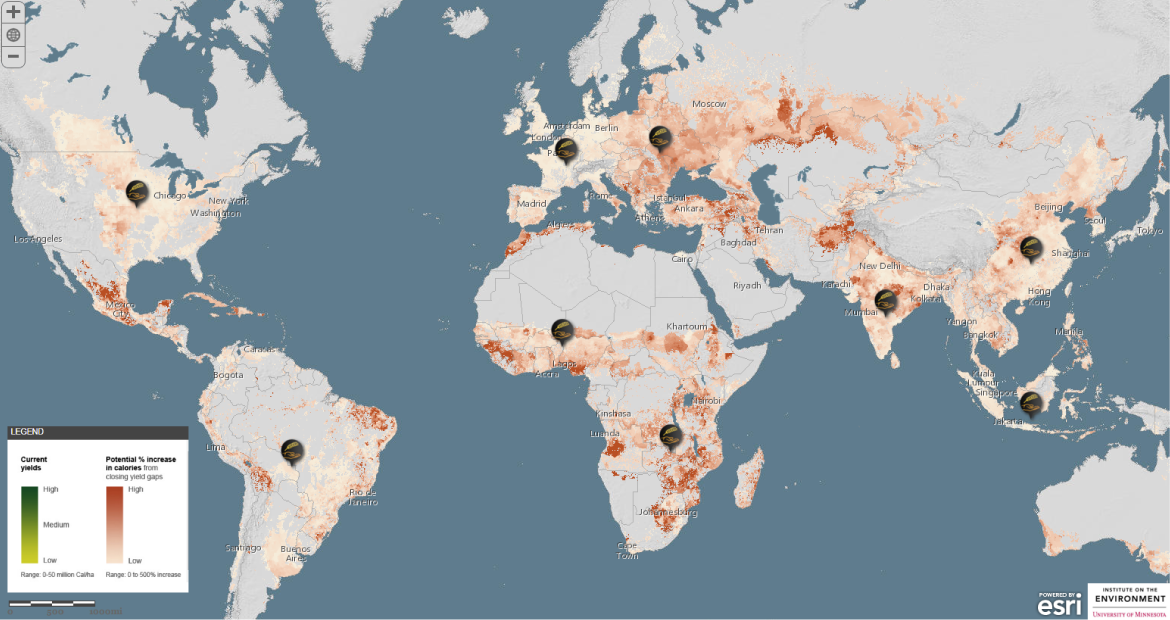
A key way to meet increasing demand for food is to make croplands more productive. Many croplands, however, fall well short of their full yield potential for their climate. Boosting yields to 95% of their potential–largely through improving nutrient and water management–would increase crop production by 58%. You can see this yield gap on a map which illustrates the potential calorie gains by closing yield gaps for few major crops, mainly cereals. Crop yields vary from moderate in Brazil and western Europe, moderate to high across western Africa, in the Great Plains in North America and India, to very high in eastern and southern Africa, where improvements in nutrient and water management could potentially double (even quadruple) yields. In China yield gaps range from low to high, with most of the potential calorie gains in northern China. In Indonesia yield gaps are low, largely influenced by strong production of oil palm.
Increasing water use efficiency
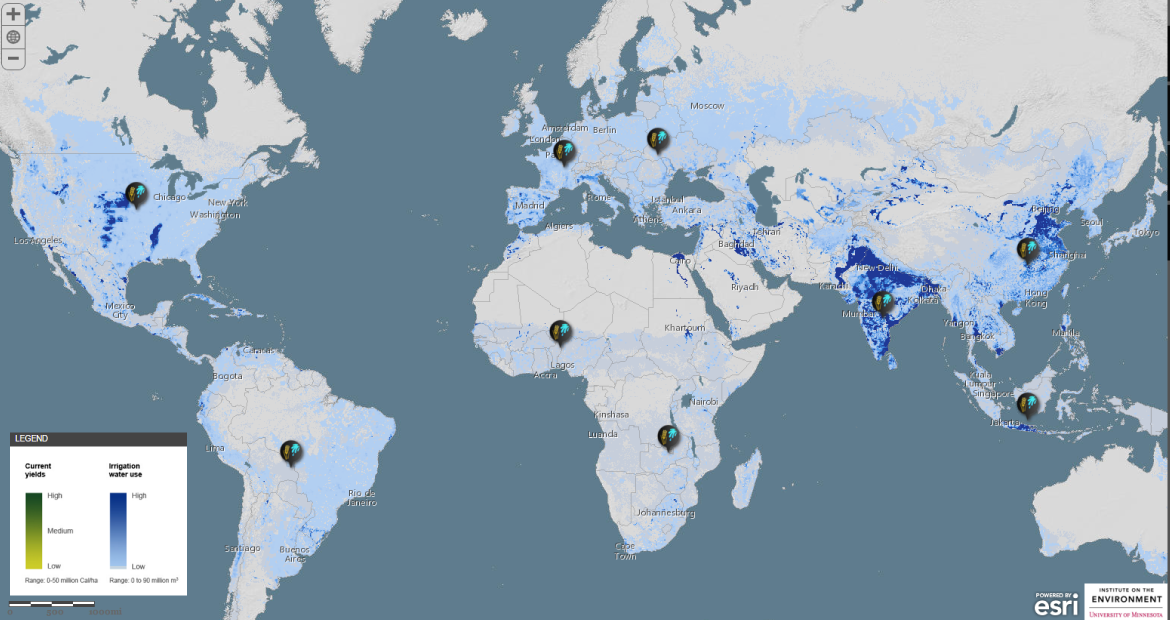
70 % of humanity’s freshwater withdrawals are for irrigating crops. Nearly a quarter of all croplands are irrigated; these lands provide a third of global crop production. Although this production is critical for food security, more efficient methods are needed to ensure a sustainable supply of water for other human and natural uses. This map shows patterns of irrigation use. Note that ‘zero’ values indicate that one or more of the major crops are grown in these areas, but are not irrigated. In Great Plains, India, China and semi-arid and Mediterranean regions irrigation is used extensively, mainly where rainfall is insufficient for regular crop growth. The water is used from surface water sources, as well as non-renewable sources like groundwater. Brazil has sufficient amount of rainfall to grow crops during the wet season. Crops grown in the dry season typically have lower yields, but provide additional income and reduce soil erosion. On the other hand, in Africa irrigation is necessary, but water sources are limited, as well as in Indonesia, where irrigation is largely limited to rice producing areas.
Changing crop use & diet
About 62% of crop production is for food; 35% is used for animal feed and 3% is harvested for fuel and other industrial uses. Shifting more crop production toward food use could potentially add about 50% more calories to the global food supply. Although a complete shift may be impractical, reducing meat consumption can have a strong influence on food security. This map depicts the proportion of crop production that is used for food. Nearly all crops produced in Africa, India and China are used directly as food while in Indonesia is used only 2/3 of the crop production. In recent years, demand for animal feed (domestically produced and imported) has increased as meat consumption has increased. In North and South America majority of the crop production is used for feed and fuel, while in Europe only half of the crop production is allocated to feed and fuel. As a result, only a small fraction of the calories produced reach the dinner table.
Crop production will have to double by 2050 to fulfill the needs of a growing and increasingly affluent population. Meeting this challenge will be difficult but not impossible.
Source: Esri
