
Preventing Pests and Diseases on Time: The Three-Layer Early Warning System
Pests and diseases cost yield when treatment comes late or on a guess. A three-layer early warning system, forecast, weather station and traps, tells you when to prepare, when to watch and when to act.
Barbara Busic
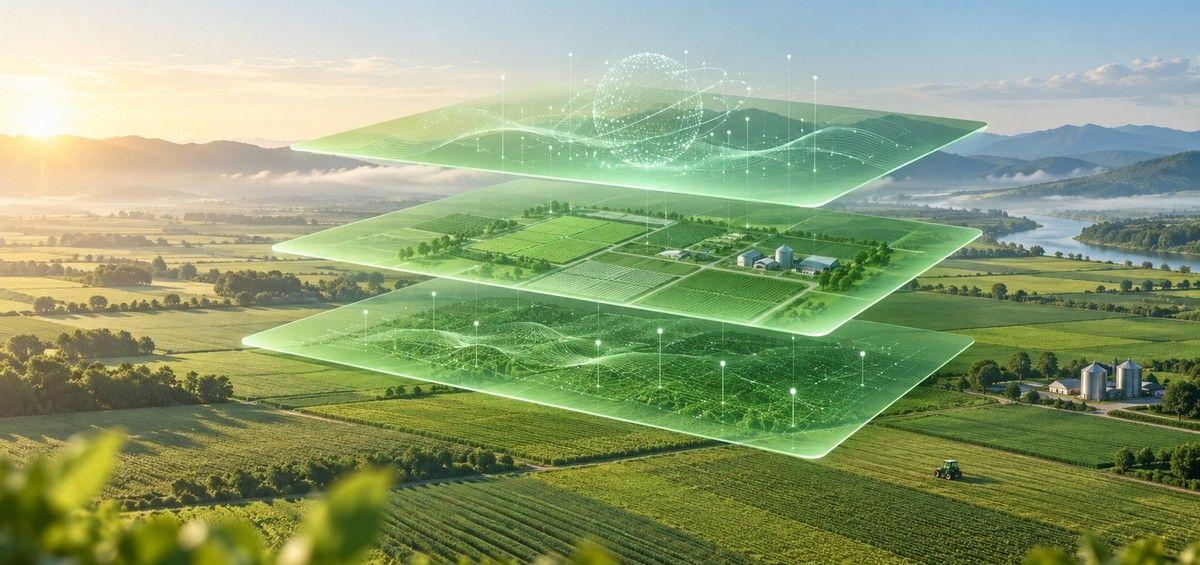
To prevent pests and diseases on time, use three layers of information: the weather forecast for early risk detection, a weather station for confirming current risk, and traps and scouting for confirming the pest or disease itself. Each layer answers a different question, and together they tell you when to prepare, when to watch closely and when to act.
Pests and diseases take a large share of every crop. Estimates of yield losses run from 20% up to 40% a year worldwide, and the damage is far higher when protection comes after the problem appears. The usual mistakes come from information that is missing or late: spraying on the calendar, spraying on a forecast alone, or waiting until the damage is visible. A layered early warning system fixes this by separating three jobs: spotting risk early, confirming it on the farm, and confirming the pest before you spend money on treatment.
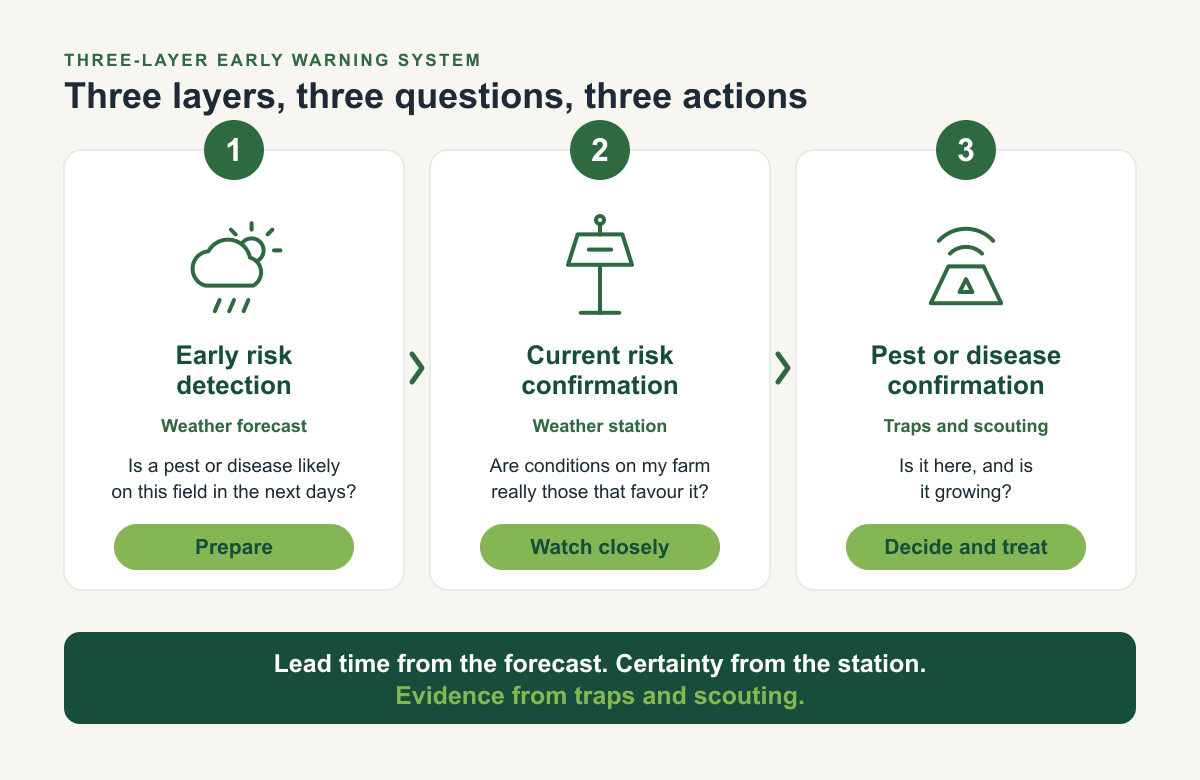
At a glance
- Layer 1, early risk detection: the field weather forecast shows days ahead when conditions favour a pest or disease. Action: prepare.
- Layer 2, current risk confirmation: a weather station shows the conditions your crop really experiences. Action: watch closely.
- Layer 3, pest or disease confirmation: traps, scouting and imagery show that the pest or disease is present and growing. Action: decide and treat.
- Result: fewer unnecessary sprays, treatment at the right moment, and a record that proves why you acted
Why timing decides the outcome
Protection works best before a population or infection takes hold. Treat early, and one well-timed, targeted application is often enough. Treat late, and the pest or disease has built up, damage has already happened, and you often need broader products and repeat sprays. A few examples quoted in our earlier articles: leaf scald of barley can reduce yield by 30-50%, brown leaf spot in sugar beet by 20-40% and Colorado potato beetle by 30-50%. Timing also matters the other way round. Spraying too early, on a forecast that never materialises, wastes product, labour and money and adds to resistance pressure.
The aim is therefore not simply to spot a threat but to spot it at the right time and with enough certainty to act.
Layer 1: early risk detection with the weather forecast
The question it answers: is a pest or disease likely to become a problem on this field in the coming days?
Most pests and diseases need particular weather: a range of temperatures, humidity and rain over a period. A field-level forecast can be matched against those conditions. When the forecast overlaps with the conditions in which a pest or disease occurs, you get a warning up to a week ahead, before anything shows in the field.
What you do with the signal:
- put traps in place and check that they are working
- plan scouting for the fields and crop stages at risk
- check product availability and equipment
- look at the spray window, since protection also depends on rain-free periods, wind and temperature (see AGRIVI Spray Advisor)
- do not spray yet: a forecast is a probability, not proof
In AGRIVI 360 FMS every field has its own forecast. The system matches the upcoming weather with conditions for pests and diseases in its knowledge base and sends an alarm up to 7 days ahead. For each pest or disease, it lists the active substances you can use, whether chemical, organic or biological, and the commercial products that contain them. You can also build your own weather alarms with the time period, minimum duration, temperature and humidity that matter for your crop, and assign them to chosen fields or crop productions. Read more in how pest alarms work and how the weather forecast helps you plan field activities.
Layer 2: current risk confirmation with a weather station
The question it answers: are the conditions in my crop, right now, really those that favour the pest or disease?
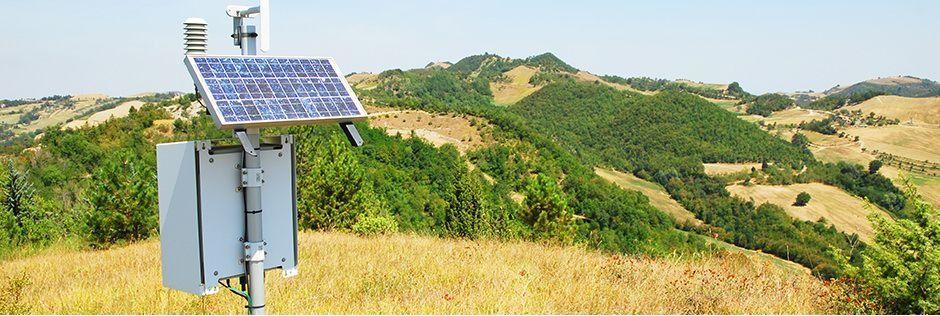
A forecast describes expected weather for an area. A weather station measures what is actually happening on your farm: air temperature, humidity, rainfall, wind and solar radiation, and with extra sensors, soil temperature and moisture. This is the confirmation step. It shows whether the risk in the forecast has become real in your grove, orchard or field, and how long the conditions have lasted, which is often what a disease needs.
What you do with the signal:
- if the measured conditions confirm the risk, move from watching to intensive scouting and trap checks
- if they do not, you avoid reacting to a forecast that did not materialise
- record the conditions so you can compare forecasts, measurements and outcomes over the season
Placement matters. A station should stand on level, grassed ground away from buildings, and in a mixed farm it should represent the field block, not sit beside one crop. Our guide to weather stations explains what a station consists of and where to put it, and why weather monitoring matters in farm production covers the wider case.
AGRIVI 360 FMS brings station data into the same place as the forecast and the pest alarms, so a forecast warning can be checked against measured conditions on the farm.
Layer 3: pest or disease confirmation with traps and scouting
The question it answers: is the pest or disease actually here, and is it growing?
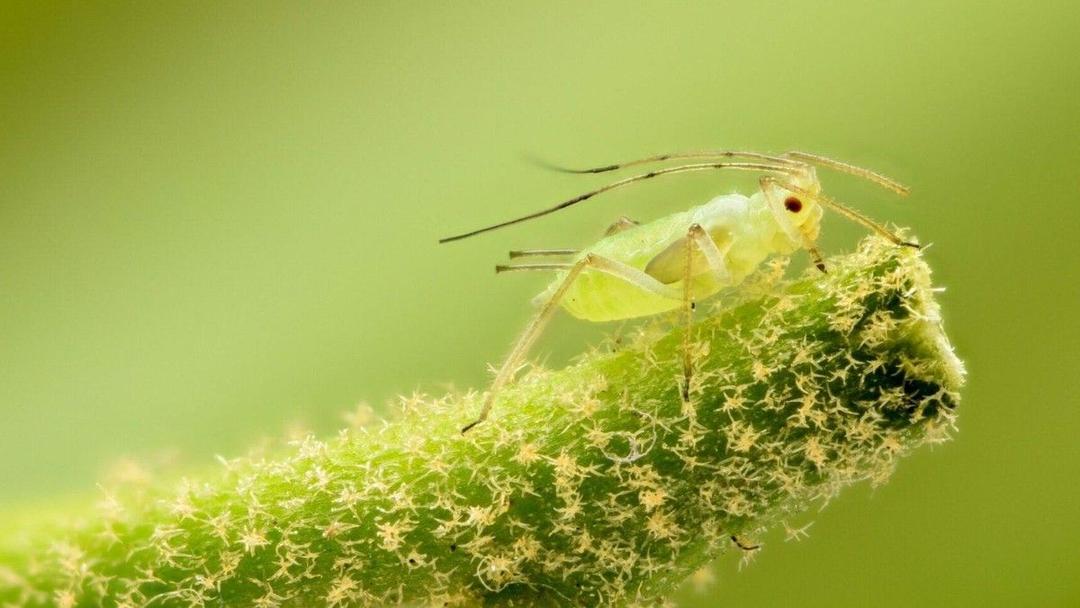
This is the layer that justifies treatment. Three sources work together:
- Traps. Pheromone and sticky traps catch adults and show population trends. Electronic traps photograph the sticky surface, count the target insects and send the numbers daily, so a build-up shows within a day or so instead of at the next manual check. In AGRIVI 360 FMS, connected TrapView traps appear as pins on the farm map with the current count, last week's count and a trend chart for the season. See how pest trap integration closes the gap between field data and farm decisions.
- Scouting. A person on the field confirms what traps and imagery suggest, finds where in the field the problem is, and collects evidence with notes, location and photos. Alerts and satellite imagery can point to the places worth visiting first. See how AGRIVI supports scouting.
- Imagery. Satellite and drone images show crop stress and variation before it is visible from the ground and help decide where to scout. See satellite imagery for risk management and disease detection with drone imagery.
What you do with the signal: compare the counts and findings with your threshold. At or above it, treat, using the least disruptive measure that works. Timing is what keeps treatment narrow: see how detection timing decides spray economics.
How the three layers work together
An illustrative sequence, not a recipe for one pest:
- Day 0, forecast. An alarm shows warm, humid weather arriving in about five days, which suits the pest. You check traps, plan scouting and look at the spray window.
- Day 4, weather station. Measured temperature and humidity on the farm match the forecast and have held for a day. You raise the scouting and trap-check frequency.
- Day 5, traps and scouting. The electronic trap count rises and scouting finds the first signs. Counts reach your threshold.
- Day 5 to 6, action. You treat the affected blocks with a targeted measure inside the best spray window, and record the product, dose, area and waiting period.
- After. You check traps again to see whether the treatment worked and use the record to review the season.
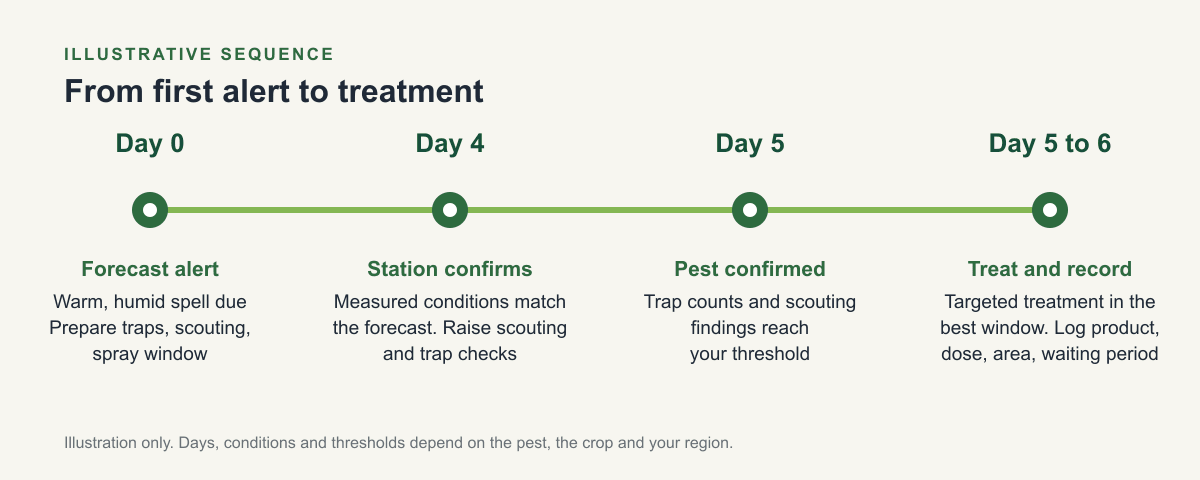
Each layer fixes the weakness of the others. The forecast gives lead time but is a probability. The station confirms conditions but does not show the pest. Traps and scouting prove the pest is there but, on their own, tell you late. Used together, you get lead time, certainty and evidence.
A decision checklist
- Alert received. Prepare: traps, scouting plan, products, equipment.
- Conditions confirmed. Watch closely: more frequent scouting and trap checks.
- Pest or disease confirmed above threshold. Choose a measure, starting with biological and cultural options and using targeted chemical treatment when needed, in line with integrated pest management (IPM).
- Pick the spray window. Rain-free period, wind, temperature and droplet size.
- Record the action. Product, dose, area, date and waiting period.
- Review. Compare forecast, measurements and trap counts with the outcome, and tune your thresholds and alarms.
What the system gives you
- Fewer unnecessary sprays, because you act on confirmed risk, not on the calendar or a forecast alone
- Treatment at the right moment, which keeps it targeted and reduces the number of applications
- Evidence for compliance and buyers. Scouting notes, trap counts and spray records justify each treatment and support traceability. See agriculture traceability
- A clearer cost picture. Every application is recorded against the field and crop. See how to track farm costs
- Fits IPM, because monitoring comes first and treatment follows thresholds
Where it matters most
The approach pays back most where pests and diseases move fast and treatment is costly: orchards, vineyards, berries, vegetables and olive groves, and on large farms and cooperatives where many fields and people have to act on the same information. For a crop-specific example, see how the same layers apply to olive fruit fly, and for the first spray of the season, spring crop protection planning.
Frequently asked questions (FAQs)
How do you prevent pests and diseases on time?
Combine three layers: a field weather forecast for early risk detection, a weather station to confirm current conditions, and traps, scouting and imagery to confirm the pest or disease. Act when the third layer confirms the problem, and record what you did.
What is an early warning system for pests and diseases?
A set of information sources that tell you about a risk before damage shows. The common core is a weather-based forecast, measured weather conditions on the farm and monitoring by traps and scouting.
Why use a weather station if I already have a forecast?
A forecast describes expected weather for an area. A station measures what is happening in your crop, so it confirms whether forecast risk has become real and how long the conditions last.
How do electronic pest traps help?
They count captured insects from photographs and send the numbers daily, so you see a rising population within a day or so, not at the next manual check.
Should I spray when I get a pest alert?
An alert means conditions favour the pest, not that it is present. Use it to prepare, confirm with conditions on the farm and with traps and scouting, and treat when your threshold is reached.
Does this approach work for diseases as well as insect pests?
Yes. Diseases depend heavily on temperature, humidity and rainfall, so forecast alerts and station data are especially useful, and scouting and imagery confirm infection.
How does AGRIVI 360 FMS support the three layers?
It provides field forecasts with pest and disease alerts up to 7 days ahead and custom weather alarms, brings weather station data into the same system, connects TrapView electronic traps and records scouting and spray activity per field.
Put the three layers to work on your farm
Explore AGRIVI 360 FMS or book a demo to see forecasts, alarms, traps and scouting on one map.
Ready to digitalize your farm?
See how AGRIVI can help you apply these insights in your own operations.
Book a Meeting